
-
Pathways to United States Citizenship – (USC): Focus on the EB-5
Every individual who ultimately becomes a naturalized U.S. citizen must first qualify for lawful permanent resident (“LPR”) status unless a narrow statutory exception applies. Although public attention frequently focuses on the EB-5 immigrant investor program, with the idea they are those with greater assets and income (contemplating taxes) EB-5 investors represent only a very small percentage of all individuals who become lawful permanent residents. Understanding the relative size of each immigration pathway is essential because every pathway ultimately raises many of the same U.S. tax issues—including worldwide income taxation, estate and gift taxation, and the tax consequences of later abandoning lawful permanent resident status or renouncing U.S. citizenship.
The EB-5 visa has been a fixture of U.S. law since the early 1990s. It was not until 2009 that a substantial number of EB-5 visas were issued in a given year, 4,218 to be exact. Statistically, the total EB-5 visa leading to LPR status is a fraction of the other categories as explained here. For an excellent overview of the law and categories, see the CRS report- Permanent Legal Immigration to the
United States: Policy Overview (Updated November 4, 2024) 
-
EB-5 Visa – to a “Green Card” then to United States Citizenship – (USC)
From the laws inception in 1992 through FY2004, there were only 6,024 EB-5 visas issued during that 12 year period. That is an annual average of only approximately 500 persons. See, the GAO Report on Immigrant Investors. As the program grew in popularity so too did the location of investors from around the world. It was not until 2009 when the total number of investors started growing substantially. Most significantly in 2009 when 4218 EB5 visas were issued, still less than 1/2 of the 10,000 allocated annually by the statute.
These numbers kept going at an annual pace especially starting in 2012, when 6,764 EB-5 visas were issued and then around 10K+/- annually for the last dozen years or so, up until the years that were impacted by a change in the law and a bit by COVID (2020 and 2021). There are important tax consequences that can have unintended outcomes for individuals who get a green card: See, Oops…Did I “Expatriate” and Never Know It: Lawful Permanent Residents Beware! International Tax Journal, CCH Wolters Kluwer, Jan.-Feb. 2014, Vol. 40 Issue 1, p9):
-
Chinese Investors Have Dominated the total Group of EB-5 Investors
While investors come from most parts of the world, it is China that has dominated the total investment in EB-5 projects representing approximately 70% of total investors over the last 15 years. See prior post which has a chart reflecting the total Chinese investors as a percentage of total – Part II of Part II: The Gold Card – The U.S. Tax Costs – “It’s like the green card, but better and more sophisticated.”
The country-of-origin analysis is important because practitioners frequently advise clients from these jurisdictions regarding immigration planning, cross-border tax planning, and eventual expatriation planning with consequences in those countries.
I have compiled the total list of countries from which EB-5 visa investors came from as summarized in the Country of Origin global graphic for FYE 2024. There are over 100 countries from which these investors came from, but again, China is the dominant country, followed by Vietnam, India, Taiwan and then South Korea as the countries with the greatest number of investors. South Africa comes next, followed by Brazil and then Mexico, but each with less than 200 total investors, each country as follows:
| China | 9547 |
| Vietnam | 1533 |
| India | 1428 |
| Taiwan | 513 |
| Korea, South | 325 |
| South Africa | 158 |
| Brazil | 157 |
| Mexico | 128 |
| Hong Kong S.A.R. | 116 |
| Venezuela | 97 |
| Canada | 81 |
| Great Britain & N. Ireland | 63 |
| Russia | 58 |
| Nigeria | 52 |
| Turkey | 44 |
| Colombia | 44 |
| France | 38 |
| United Arab Emirates | 30 |
| Germany | 29 |
| Japan | 25 |
| Singapore | 23 |
| Kazakhstan | 21 |
| Peru | 20 |
| Ukraine | 17 |
| Sweden | 15 |
| Argentina | 15 |
| Egypt | 14 |
The importance of this analysis is to help individuals (and their advisors) who fit into these categories, e.g., who have a pathway to a green card and then on to become a naturalized U.S. citizen, understand the potential “tax expatriation” consequences of their decisions over the long-run.
-
- What are the U.S. “tax expatriation” consequences to individuals who go down these pathways, including to their dependent children, or spouses or any future beneficiaries who are “United States person”?
-
- What are the tax expatriation consequences if the individual later decides they do not want to be a green card holder or a U.S. citizen and later wishes to abandon their lawful permanent residency status or formally renounce their U.S. citizenship?
- What are the tax expatriation consequences if the individual later decides they do not want to be a green card holder or a U.S. citizen and later wishes to abandon their lawful permanent residency status or formally renounce their U.S. citizenship?

These and many other questions should be considered, especially for long-term family planning. Not just for the investor, but for their children and spouse, who may be eligible for the visa that can lead to LPR status and eventually to USC. Facilitating younger children (under 21 years of age) is a common driver for EB-5 investors for families who want the United States to be a pathway for their children’s’ future.
-
Why These Immigration Pathways Matter from a Tax Perspective
The purpose of this analysis extends beyond immigration statistics and EB-5 is only a small pathway. For historical reference, see a prior post: How Many Lawful Permanent Residents does the U.S. Receive (Per Year: 1820-2022)
Every pathway leading to lawful permanent resident status almost always subjects the individual to the comprehensive U.S. federal income tax system. Depending upon the individual’s assets, family structure, treaty residence, and future living plans, obtaining a green card will also have significant implications for:
- worldwide income taxation;
- estate and gift taxation;
- foreign trust reporting;
- information reporting obligations under various laws;
- controlled foreign corporation rules;
- PFIC reporting;
- exit tax planning; and
- long-term succession planning.
Equally important, many lawful permanent residents eventually decide to return permanently to their country of origin or another foreign jurisdiction. Those individuals—and frequently their spouses and dependent children—must carefully consider the tax consequences of formally abandoning lawful permanent resident status or, after naturalization, renouncing U.S. citizenship. The sooner individuals and their advisors realize these consequences, the better they can plan for important life decisions.
Those tax consequences are collectively referred to as the U.S. tax expatriation rules, and they form the principal subject of this website.
The legal pathways towards lawful permanent residency status can be broken down into the following categories and the EB-5 category is a fraction (only about 1%) of the total pool leading to LPR status:
A. Family-Sponsored Immigration
This is the most common pathway used for spouses, unmarried children who are under twenty-one years of age and parents of an adult U.S. citizen. See, 8 U.S. Code § 1153(a). The table below further breaks down immediate relatives (which has no cap) versus family preferences (F1-F4) which has strict statutory limits of the total issued. See, U.S. Department of State, Visa Bulletin For June 2026, describing these limits including the per country limits. Approximately 64% of all green card holders come through this family sponsored category according to the U.S. Department of Homeland Security, Office of Homeland Security Statistics (OHSS), Yearbook of Immigration Statistics, Table 6 (Persons Obtaining LPR Status by Type and Major Class of Admission).
B. Employment-Based Immigration (Including EB-5)
This category includes EB-1 through EB-5 categories that include individuals with extraordinary ability, certain professionals, other skilled workers. The chart I prepared here reflects the total number of EB- 5 visas issued cumulative. This chart reflects the total number of cumulative EB-5 visas that have been issued through the FYE 2024 of approximately 131K. This does not take into consideration how many of these were issued to the principle investor versus spouses and children under twenty-one years of age. See, 8 U.S. Code § 1153(b).
EB-1, EB-2 and EB-3 represent the greatest group of individuals who obtained LPR status (e.g., approximately 5X, each category compared to the EB-5 category). See Yearbook of Immigration Statistics, Table 6.
For instance, annually the EB-1 through EB-3 categories are processing about 50K per year of each, and the EB-5 category is only 131K over most of its 25 year life (or about 10K per year – for more recent years). Approximately 16% of all green card holders come through these employment based preferences.
Table – Approximate Decade-Average Share by Category, FY2014–FY2023
| Category | Approx. Share | Notes |
| Family-sponsored (total) | ~64% | Immediate relatives + family preferences combined |
| — Immediate relatives | ~46% | Spouses ~26%, parents ~14%, children ~6% |
| — Family preferences (F1–F4) | ~18% | Numerically capped at 226,000 |
| Employment-based (EB-1–EB-5) | ~16% | Capped at 140,000; breached in COVID years |
| Refugees & asylees | ~12% | Numerically unlimited; ceiling-driven volatility |
| Diversity | ~4% | Statutory ceiling 55,000 |
| All other / special | ~4% | SIV, U/T victims, cancellation, registry, etc. |
C. Diversity Immigrant Program
The annual diversity lottery, allocated by random selection, to natives of countries with historically low rates of immigration to the United States. See, 8 U.S. Code § 1153(c). The Attorney General plays a key role by statute in this determination. There is a statutory maximum of 55,000 and only represents about 4% of all LPRs compared to the larger pool. This program is on hold as of December 19, 2025 when the USCIS policy memorandum (PM-602-0193) directs officers to place an immediate hold on pending adjustment of status, ancillary benefits and associated waiver applications for individuals applying through the Diversity Immigrant Visa program. [1, 2]
D. Humanitarian and Special Pathways: Refugees/Asylees
Several routes proceed outside the preference system (the three categories above). Refugees and asylees adjust under a specific statutory regime; self-petitioning abused spouses and children proceed under other provisions; victims of qualifying crimes and of trafficking can adjust from U and T nonimmigrant status; and certain children subject to qualifying juvenile-court findings can qualify, among others. There are statutory limits placed on this group.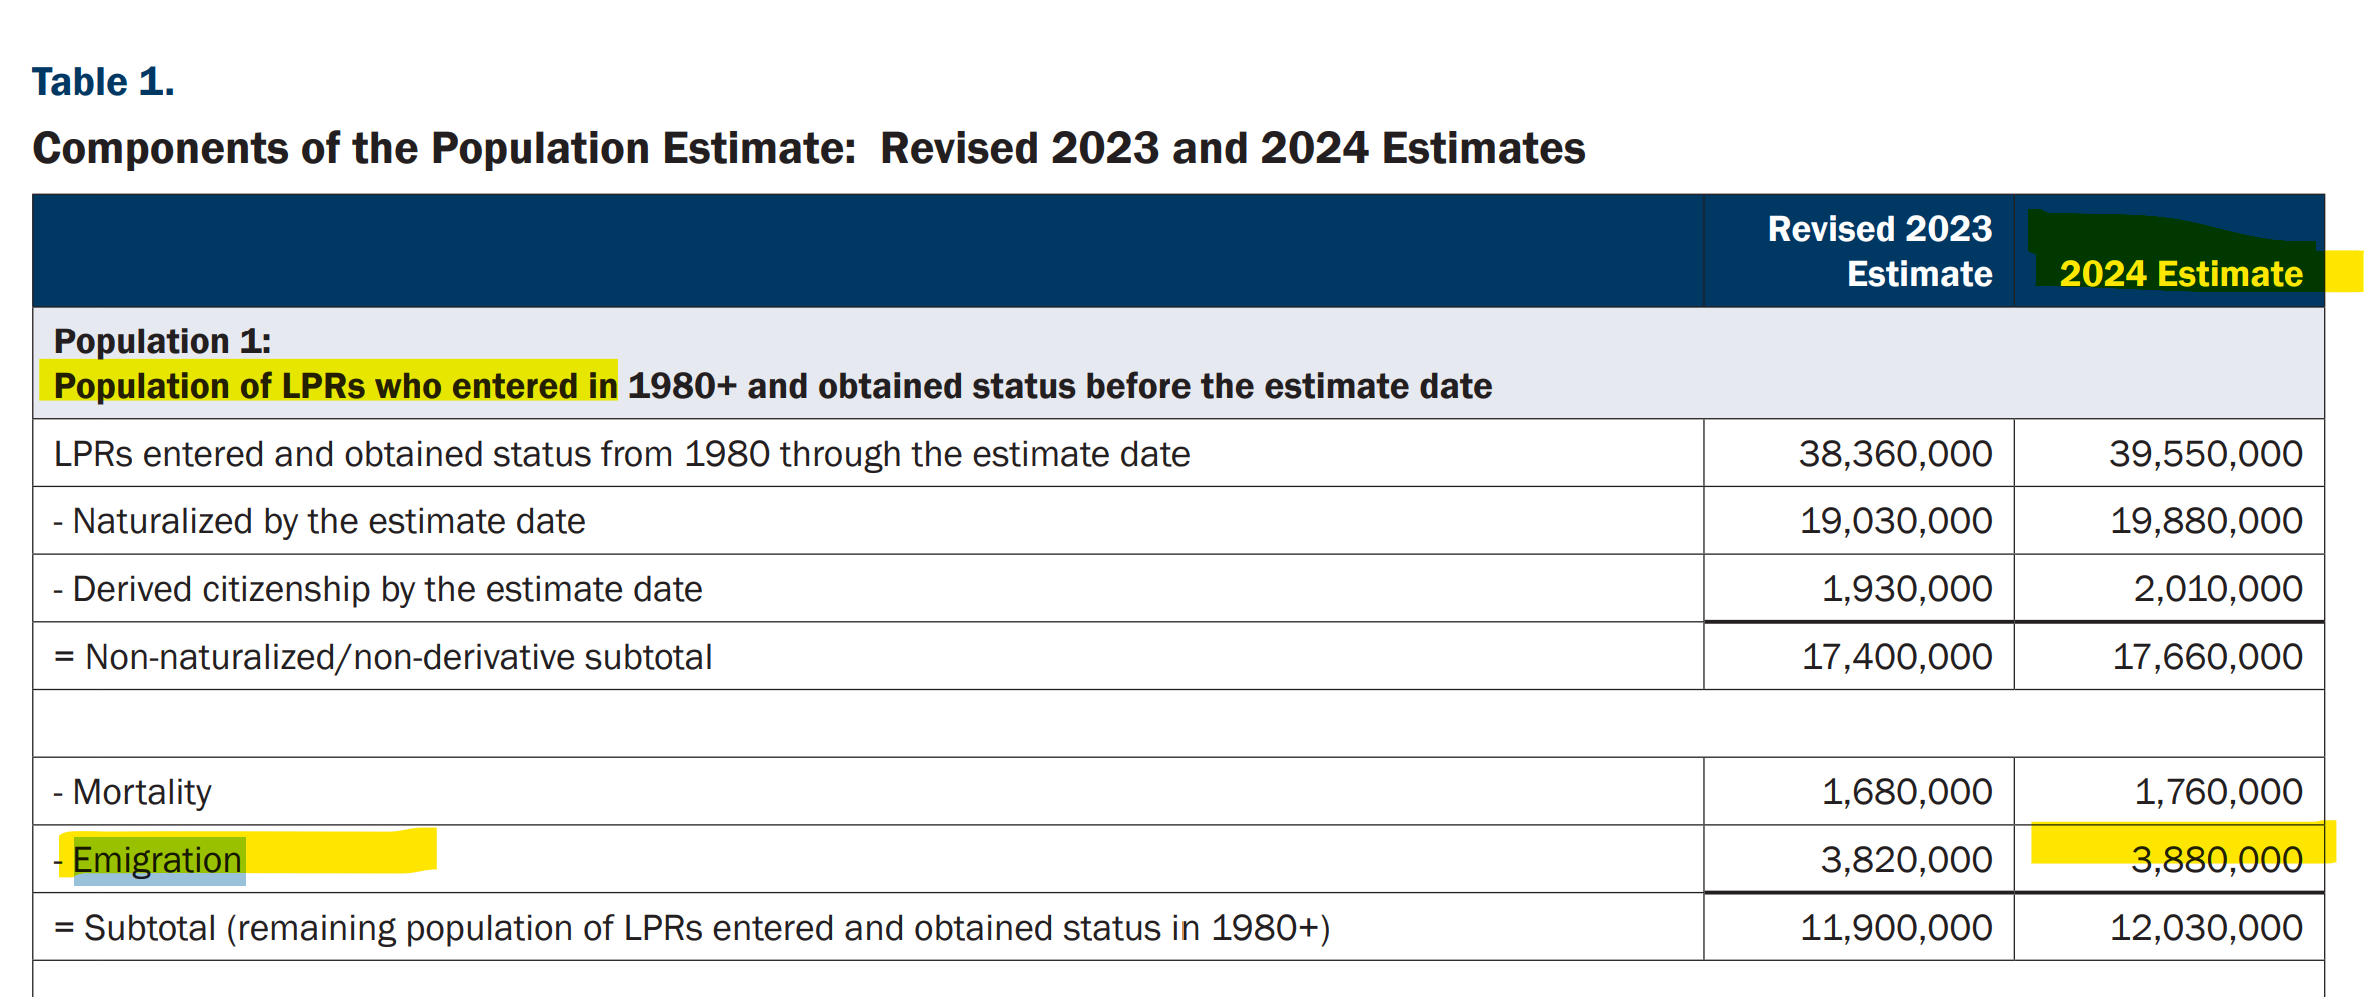
Whatever category one uses for LPR status, there will be important U.S. federal tax consequences to them and typically their family members. That’s the large part of the focus on this forum where the author has written about the subject of how it all ties to “tax expatriation”. As previously reported, there are 3.88 million “LPR” individuals who are living outside the U.S. – per the 2024 report by the U.S. federal government. Many of them live in a treaty country. See, Table 1 of the Homeland Security, Office of Immigration Statistics – Estimates of the Lawful Permanent Resident Population in the United States and the Subpopulation Eligible to Naturalize: 2024, and Revised 2023.